
Understanding Power Quality in Industrial Facilities
The essential electrical indicators behind reliable equipment health, harmonic mitigation, and electrical switchgear resilience.
Salma Trabelsi
Energy Systems Engineer
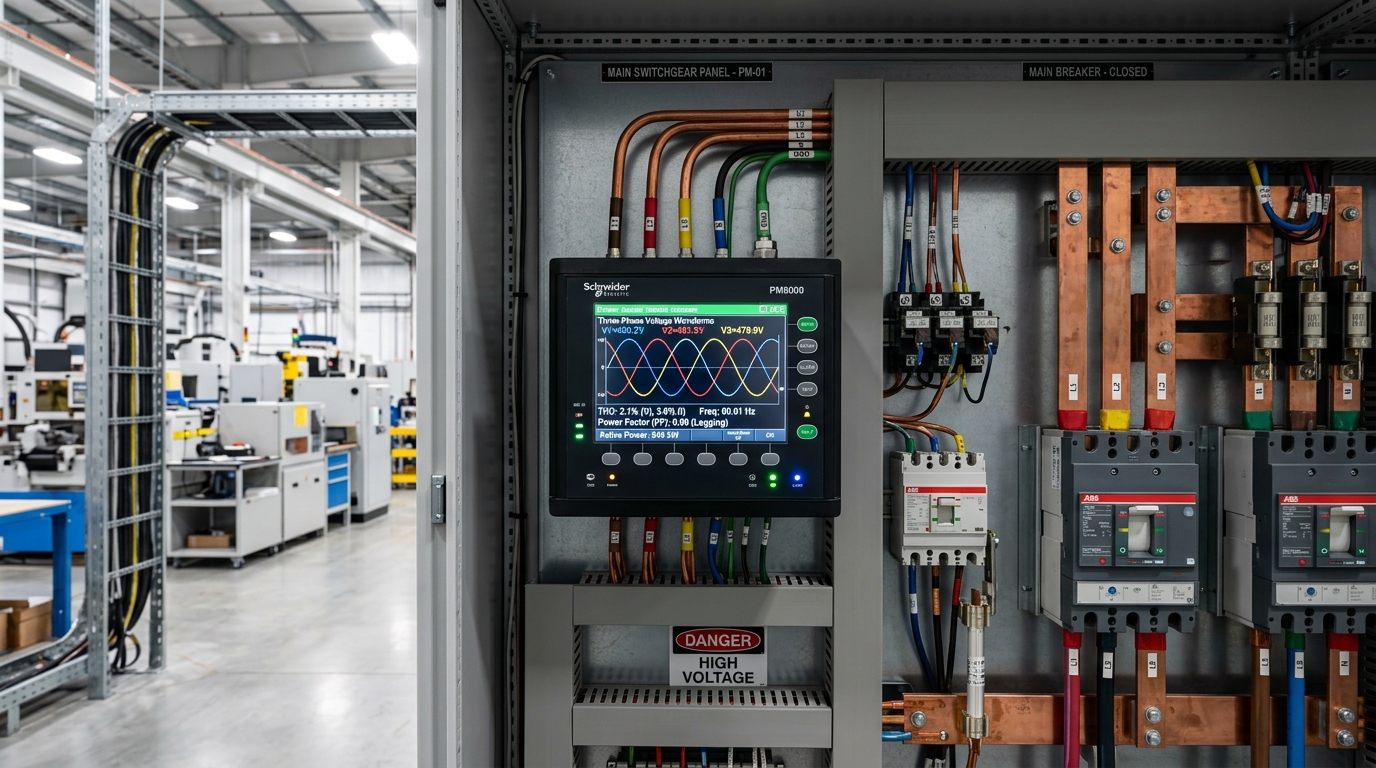
Key Operational Telemetry & Impact
< 5.0% THD
IEEE 519 Standard
Maximum allowable Total Harmonic Voltage Distortion at Point of Common Coupling
80% Linked
Equipment Premature Failure
Electronic drive and motor insulation breakdowns caused by micro-surges & harmonics
> 0.95
Target Power Factor
Optimal ratio to eliminate reactive power utility penalties
Class A
Sampling Speed
High-speed waveform transient capture and harmonic spectrum analysis
1. Beyond Simple Voltage and Amperes
When electrical problems occur on the plant floor, technicians usually reach for a standard handheld multimeter to check line voltage. If the meter reads 400V or 480V, they assume the electrical supply is healthy. Unfortunately, standard RMS multimeters only measure aggregate root-mean-square values; they are blind to the waveform distortions, harmonic currents, and micro-second voltage sags that actively destroy sensitive electronics.
In modern automated factories, clean sinusoidal 50Hz/60Hz alternating current is increasingly rare. The proliferation of non-linear loads—Variable Frequency Drives (VFDs), servo controllers, arc welders, uninterruptible power supplies (UPS), and LED drivers—injects severe electrical pollution back into internal plant distribution networks.
High Total Harmonic Distortion (THD) causes excessive eddy current heating inside electric motor windings, degrading insulation and reducing motor operational lifespan by up to 50%.
2. The Physics of Harmonics & VFD Non-Linear Loads
Harmonics are voltages or currents with frequencies that are integer multiples of the fundamental power frequency (e.g. 150Hz, 250Hz, 350Hz in 50Hz systems; 180Hz, 300Hz, 420Hz in 60Hz systems). When 6-pulse or 12-pulse rectifier circuits in VFDs draw current in non-sinusoidal pulses, they produce strong 5th, 7th, 11th, and 13th harmonic currents.
These harmonic currents travel upstream through transformers and distribution busbars, causing severe voltage drops across system impedances. Overheated neutral conductors, tripping circuit breakers with no apparent overload, and vibrating transformer cores are classic symptoms of high harmonic distortion.
- Voltage THD (Total Harmonic Distortion) must be maintained below 5.0% according to IEEE 519-2022 standards.
- Individual odd harmonic components must not exceed specific percentage ceilings (e.g. 3% for 5th and 7th harmonics).
- Continuous harmonic spectrum analysis reveals whether passive LC tuned filters or Active Harmonic Filters (AHFs) are operating correctly.
3. Voltage Sags, Swells & Micro-Transients
A voltage sag is a momentary drop in RMS voltage between 10% and 90% lasting from half a cycle (10 milliseconds) to several seconds, commonly caused by grid faults or the direct-on-line start of large multi-megawatt compressors.
While incandescent lighting barely flickers, automated robotic cells and sensitive PLC power supplies often trip on under-voltage faults. Without continuous waveform recording, maintenance teams waste hours blaming software glitches or faulty sensors when the true culprit was a 40-millisecond voltage sag on the incoming utility line.
4. Power Factor Degradation & Penalty Elimination
Power Factor (PF) is the ratio of active real working power (kW) to total apparent power (kVA). Heavily inductive loads—such as underloaded induction motors, transformers, and solenoid valves—draw large amounts of reactive power (kVAR) to maintain magnetic fields.
When power factor falls below 0.90 or 0.95, utility companies levy substantial monthly reactive energy penalties. Furthermore, low power factor consumes electrical distribution capacity, causing higher resistive heat losses in plant transformers and cabling.
Never install traditional Power Factor Correction (PFC) capacitor banks without harmonic detuning reactors in high-VFD plants: un-detuned capacitors create dangerous parallel resonance that can violently rupture capacitor cans.
5. Implementing a Continuous Power Quality Strategy
A comprehensive power quality monitoring strategy requires deploying Class A power quality analyzers at the incoming substation main breaker and strategic distribution switchboards. Real-time dashboards visualize true power factor, displacement power factor, voltage unbalance, and harmonic bar charts.
By continuously tracking power quality metrics inside RockLyzor, industrial reliability engineers prevent catastrophic downtime, safeguard sensitive robotic automation, and maintain full compliance with IEEE 519 and EN 50160 grid standards.
ENGINEERING FAQ
Frequently Asked Engineering Questions
What is the difference between active and reactive power?
Active power (kW) performs actual mechanical work (turning shafts, heating furnaces); reactive power (kVAR) sustains the magnetic fields required by inductive equipment like motors and transformers.
How does IEEE 519 apply to an industrial facility?
IEEE 519 establishes limits on the harmonic distortion that an industrial facility is permitted to inject back into the public utility grid at the Point of Common Coupling (PCC).
How does RockLyzor monitor power quality?
RockLyzor connects to multi-function electrical meters and power quality transducers to log and visualize THD, voltage unbalance, phase angles, and waveform event logs.
CONTINUE EXPLORING
Related Industrial Insights
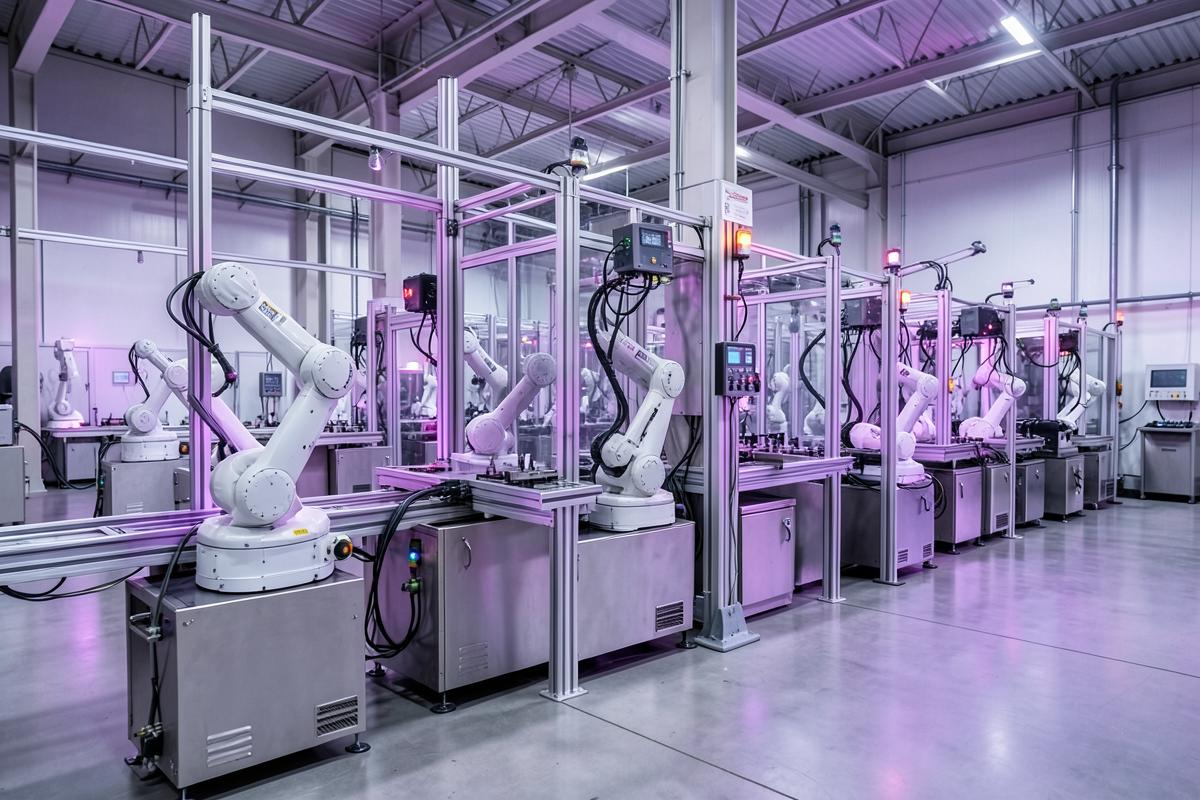
Why Real-Time Industrial Monitoring Matters
How immediate visibility helps teams reduce response time, eliminate unrecorded micro-stoppages, and keep modern factory lines moving.
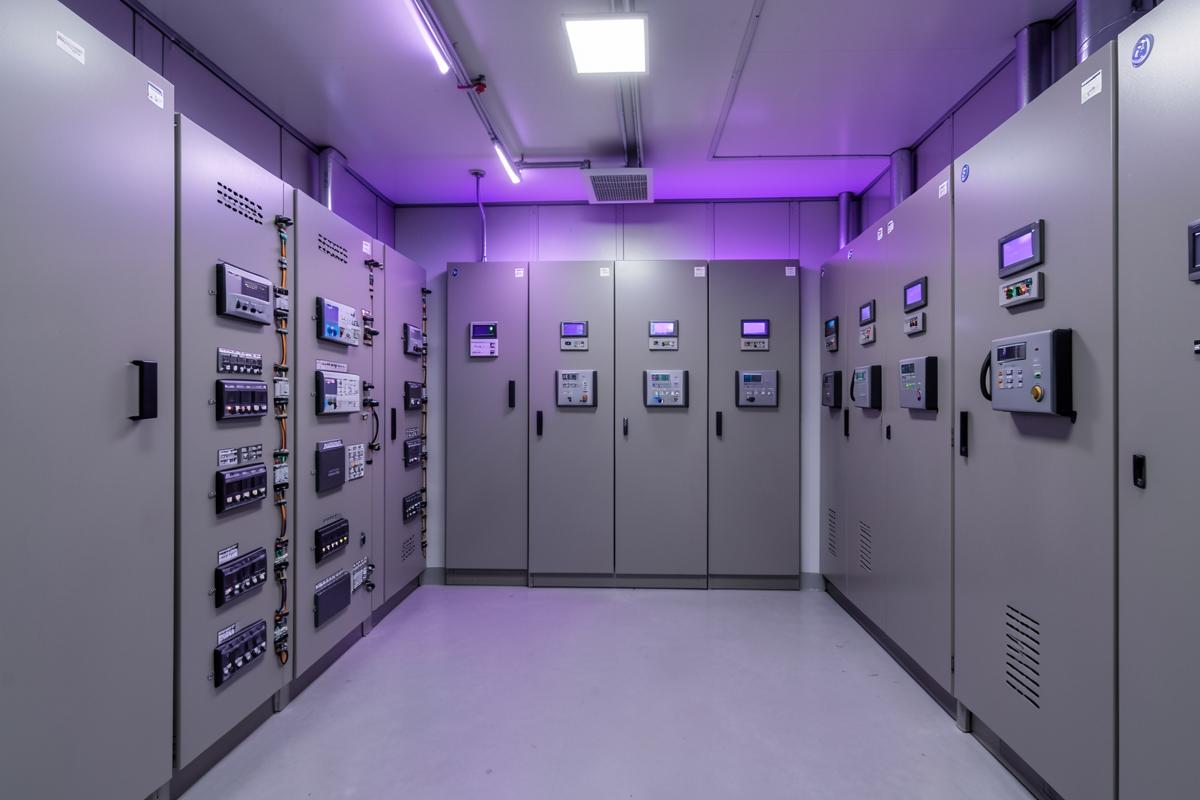
How Industrial Energy Monitoring Reduces Hidden Losses
Find consumption patterns, demand peaks, and utility penalties that traditional monthly utility invoices never reveal.
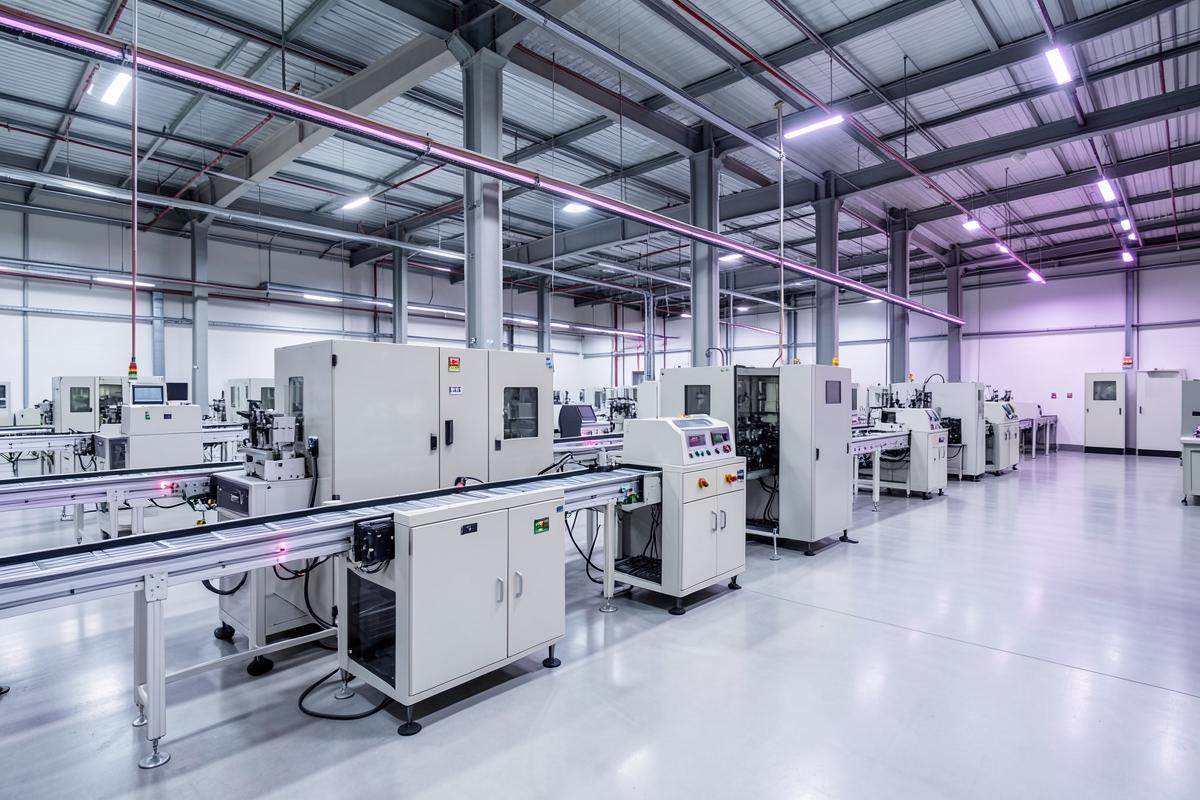
SCADA vs Traditional Industrial Monitoring
A practical technical comparison between centralized supervisory intelligence and isolated machine-level operator screens.
Start with your operation
Ready to See Your Factory Differently?
Discover how RockLyzor can centralize your industrial data and give your team real-time operational visibility.